

There is a moment every photographer knows.
The light is doing something extraordinary. You raise the camera. You meter carefully. You shoot. You get home, open the file, and something is wrong. The shadows have gone muddy. The highlights have disappeared. The feeling you stood in front of is not on the screen.
The camera did not lie. But it did not see what you saw either.
This is the problem the Zone System solves in the field. And in this post, I want to show you something that changed the way I work completely: your histogram is not a technical readout. It is a Zone System map. Once you see it that way, you will never expose a RAW file the same way again.

What Your Camera Meter Is Actually Doing
Every camera meter is trying to do one thing.
It is trying to render whatever you point it at as middle grey (18% Grey) . Zone 5 in Adams’ language.
That is not a flaw. It is a design decision. Middle grey is the mathematical centre of the tonal range, the point where the meter has the most room to work in either direction. The meter has no way of knowing whether you are pointing at a white wall, a black jacket, or a face coming out of shadow. It assumes middle grey and calculates exposure from there.
On a Leica M, this is unusually transparent. There is no scene mode, no matrix algorithm trying to guess your intention. The TTL meter gives you a reading. You decide what to do with it. That directness is one of the reasons the M is such a good camera for learning to see in zones. Nothing is being decided for you.
The same principle applies to any other camera. The meter is always trying to find Zone 5. Your job is to decide whether Zone 5 is where you want that part of the scene to land.
Adams knew this. He did not fight it. He used it. He took the meter reading as a starting point and then deliberately shifted it, zone by zone, until every tone in the scene was exactly where he wanted it before he pressed the shutter.
The Histogram as a Zone Map
Open any RAW file and look at the histogram. You will see a mountain range of tones spread from left to right.
Here is what most photographers see: dark on the left, bright on the right, and a general sense of whether the image is over or underexposed.
Here is what you should see:
[VISUAL ZONE SCALE -- insert graphic here showing the histogram divided into zones 0 through 10 with labels]
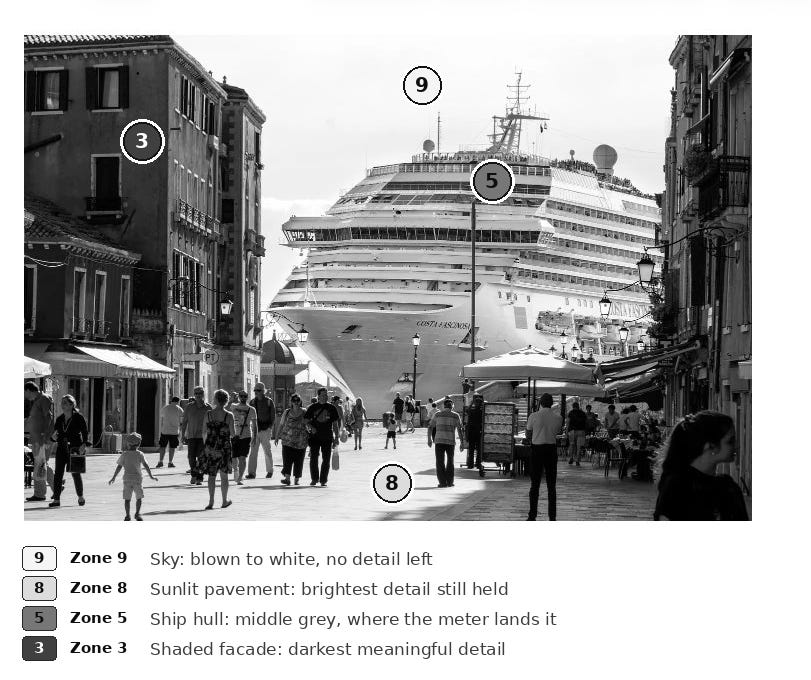
Far left -- Zone 0 and 1. Pure black and near black. No recoverable detail here. If your shadows pile up against the left wall, they are gone.
Left quarter -- Zones 2 and 3. Deep shadows with texture beginning to emerge. Zone 3 is where you want your darkest meaningful detail to live.
Centre left -- Zone 4. Dark midtones. Shadow areas on skin, dark fabric with visible texture, deep foliage.
Centre -- Zone 5. Middle gray. Where your meter wants everything to be. A clear sky in open shade, a grey card, a road in flat light.
Centre right -- Zone 6. Light midtones. Average skin tone in natural light. The most common zone for a subject’s face.
Right quarter -- Zones 7 and 8. Bright surfaces still holding texture. Zone 7 is where you want your brightest meaningful highlight to land. Zone 8 is the last place detail can survive.
Far right -- Zones 9 and 10. Pure white. Blown out completely. If your highlights pile up against the right wall, they are gone.
When you look at a histogram through this lens, it stops being a graph and becomes a map of every tonal decision in the photograph. You can read it and immediately understand not just whether the image is exposed correctly, but whether the tones are where you intended them to be.
Those are two very different questions.
This is where the free portion ends.
In the section below, I walk through the full field metering method step by step -- how to anchor a shadow, how to place it in a specific zone, and how to check whether your highlights will survive. I also cover three real exposure situations that come up constantly: a high-contrast interior with a single light source, a flat overcast street scene where the tonal range is compressed, and a backlit subject where the meter will always lie to you. For each one I show exactly what the histogram looked like before zone placement and after, and what changed in the exposure decision.
If you are not yet a subscriber, the entire Zone System series comes with a 7-day free membership. No commitment, no friction.
